Better QA through automated user experience monitoring
As web applications have become more complex over the years, having good tools for monitoring has become mandatory. Tools like New Relic, Pingdom, or Nagios are necessary for all companies that are serious about their web app’s health and performance. The need for web app health monitoring has become especially evident with the release and wide adoption of tools like StatsD.
Back then, Etsy, the creators of StatsD, introduced an interesting approach to monitoring apps by suggesting to teams to measure everything. They measured network, machines, and application performance. Of these three categories, application performance has been the hardest to measure.
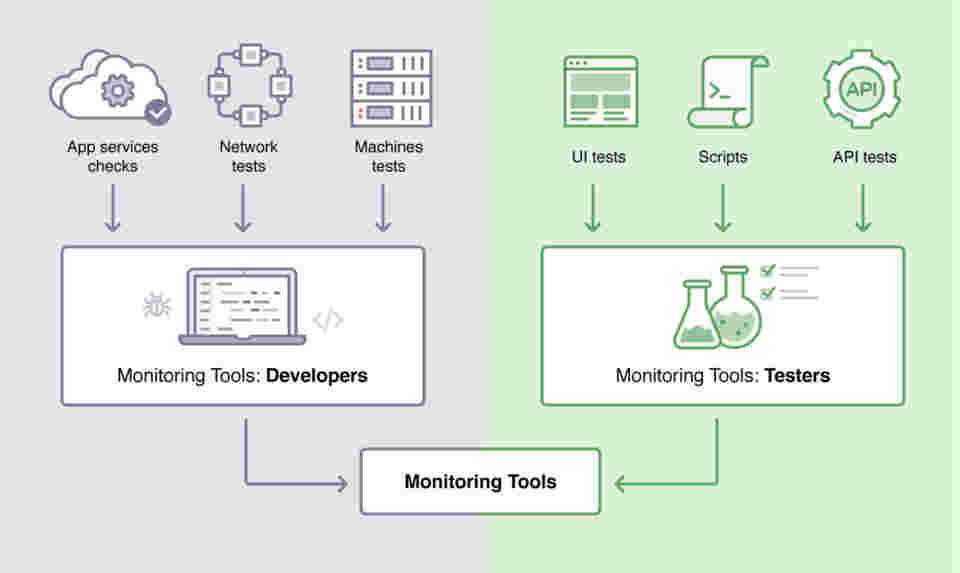
I agree completely with their approach, and the way we monitor Postmark is similar. To achieve that, we have various monitoring tools set up by our development team, systems team, and quality assurance team. You might be wondering why QA is involved in setting up monitoring—let me explain.
Monitoring tools and development/systems teams #
We have many tools for monitoring our web app setup by the development and systems teams. We have New Relic, Pingdom, Nagios and some other tools setup and tied to Postmark. They measure network speed, cpu/hard drive/memory health, API endpoint speeds, app services and more. These tools are not ideal, though, as they have both good and bad sides.
The good: These tools provide specific details to help developers isolate where the issue could be.
All of these apps do a great job letting our developer/systems team know about any bottlenecks that need to be fixed. They provide details where to look on servers, parts of code, on which hard drive and so on.
The bad: Sometimes these tools don’t provide high level details that customers and the team needs.
Tools setup by our developers and systems team are great for providing back-end information, but most of the time they are not great for providing the type of information that’s useful to customers. Most of the time, these tools are very specific. This is where we see what Etsy was referring to with regards to monitoring the application being the most challenging.
What do you tell a customer if CPU usage is high on one server, or if emails are slow to arrive to the inbox, if open tracking status updates are slow, or if the activity page is working? This is where tools managed by our QA team come into play.
Monitoring tools and quality assurance teams #
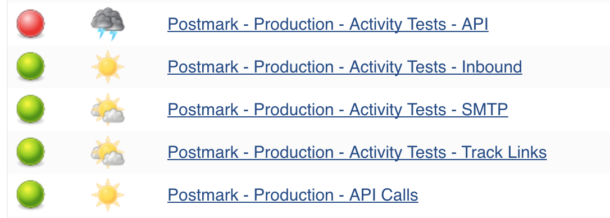
In order to solve the application monitoring problem, we introduced one more level of monitoring: monitoring the app by automated tests written by testers. These aren’t purely functional tests. These are automated and recurring tests to monitor things which are essential to customers, they monitor the end user’s experience.
For example, we’ve built tools to monitor how long it takes email to reach the inbox, how long it takes for a real activity page to load, how long it takes for an email to appear in the activity page, and how long it takes for the status of an open email to be reachable by API or visible in the activity page.
The good: These tools provides quantitative measures of the experience for users.
Monitoring the automated tests gives us insight into the performance pains customers could see while using the web application or API.
The bad: Sometimes these tools don’t provide details that are useful for developers.
These automated tests can discover that some part of the app is slow (time to inbox, open tracking, etc) and alert the team. However it’s often too high level information for developers to pinpoint the issue. The alerts raise an alarm, but they can’t solve the problem. They just let us know that we need to investigate the issue.
Monitoring tools across teams #
As you can see, monitoring tools for developers and testers complement each other. They work together to provide context and feedback for both developers and customers. We collect information from both sides and analyze it so we have a complete picture that's usable by the whole team.

How do we do monitoring with automated tests #
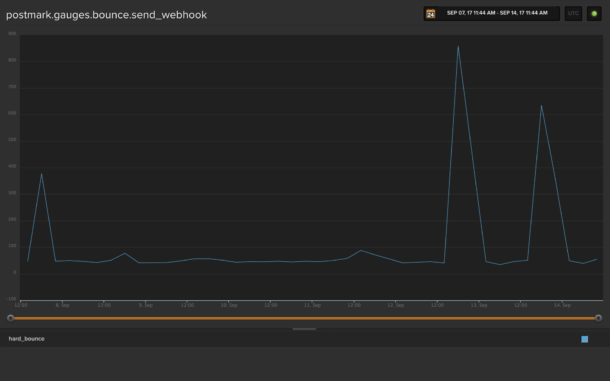
The actual monitoring with automated tests is simple. We connect all of our automated tests to Librato, an application for storing and reporting on simple statistics.

Here is a simplified code example of one of our automated tests for monitoring capabilities. To make the example more readable, a couple of different test types were combined in a single test scenario.
This example test monitors the time it takes for an email to arrive in an inbox as well as the time it takes to search for that same email within the Postmark activity feed. Time is measured in seconds. We need to be confident that the email arrives in the inbox quickly, but we also need to be confident that the email’s status is quickly and accurately reflected in the activity feed as well.
require 'spec_helper_selenium'

describe 'Activity Page' do
  include_context 'email handling'
  include_context 'email content handling'
  include_context 'email content building'

  # configuration data which will be used in the test
  let(:username) { 'username' }
  let(:password) { 'password' }
  let(:api_token) { 'api token' }
  let(:host) { 'api.postmarkapp.com' }

  # simple test scenario, which involves:
  # sending an email
  # checking email arrival to inbox
  # testing activity
  it 'send email' do
    email = build_email

    send_email(email, host, api_token)
    receiver = check_email(email)

    # once email arrived to inbox, time needed for email to arrive to inbox is sent to
    # our statistics server
    LibratoMetrics.api.gauge('postmark.email.time_to_inbox', receiver.search.duration)

    # visit the web application, using selenium page objects
    visit_page(Login).sign_in(username, password)
    on_page(Servers).click_on_server('selenium')
    on_page(ServerPage::Statistics).click_on_activity
    on_page(ServerPage::Activity).click_on_outbound

    on_page ServerPage::ActivityPage::Outbound do |page|
      # after reaching outbound activity page, measure time from starting
      # to search up to search result appearing in activity
      LibratoMetrics.api.gauge_interval('postmark.activity.time_to_appear_sent') {
        page.search_field = email.subject
        page.click_search
        expect(page.wait_for_email_to_be_sent(email.subject)).to be true
      }
    end
  end
end
The challenging part of monitoring with these kinds of tests is coverage and run frequency. Having enough automated tests written to cover all of the vital areas for the product monitoring can be an endless process, and running them frequently enough can be resource intensive, especially as the number of tests grows. Finding the right balance of these tests is tricky.
For Postmark, we have written over 1500 automated tests over the years which we run daily. We have plenty of test scenarios for Postmark we can monitor. In order to run automated tests frequently we setup our own test machines and we run our tests with Jenkins. To be able to monitor UI, running the tests frequently is essential. So you either need to be prepared to invest in test machines and their maintenance or use a service like saucelabs.com.

How monitoring affects our day-to-day work #
Monitoring app health is a crucial part of our everyday work. Knowing there are tools that are regularly monitoring every aspect of Postmark, help us sleep better at night. This also means we experience fewer surprises and have more time to focus on our regular work.
Whether there’s a high CPU usage problem, bounce service isn't working, emails aren't arriving on time, or the activity page is slow, we'll know about it. In any scenario, we’re alerted quickly so we can address problems and provide the best possible service.
Adding monitoring from the QA side helped us to push the boundaries of monitoring further. It allowed us to get an even better perspective on what can go wrong and how to react to problems more quickly. Our goal is always to be proactive and solve problems before they are even visible. For us, there is no going back, monitoring from both development and QA side is clearly the way to go.
Every app presents a different set of challenges though. They’re like living organisms that have vastly different needs. This approach works well for us. We would love to know what you think and how you solve the monitoring challenge on your side.


